A simple prompt to Sonnet 4.6 for a python script. What do I get?
Here’s the prompt.
“Please provide a python program to generate a time series of 30 ticks for three variables x, y, z. z is a function of x and y. x, y, and z vary within an upper and lower bound. The values of x, y, and z should be held as a float type. The time series for the three variables is output as a csv to a windows directory”
What did I get?
Result Received from Sonnet 4.6
“””
Time Series Generator for Variables x, y, z
– Generates 30 ticks of time series data
– z is a function of x and y: z = sin(x) * cos(y)
– All values are floats bounded within [lower, upper] limits
Did it Run? No, there was a syntactic bug. Was this a good thing?
If work in the digital realm consists of the following processes:
Identification of imperative (ideation)
determination of response (analysis and design)
Until money, time or functionality constrain:
Build, Review, Test (in an ideal world)
Deploy
Maintain
Where is Claude best deployed?
Was time saved? About a half-hour, a sixteenth of a work day. Quite a lot over a year with lots of employees. However, does repeated use of Claude not only train Claude but train the user so that over time, Claude becomes a bit of a bore, perhaps an expensive bore at that.
Hang on, what happens if Claude is the only tool available to do the job? Now that’s a different story.
No programmers in town for iterative development of prototypes for customer appraisal.
The digital computing machine is at the end of a Rogers’ innovation curve. Is “AI” just a last hurrah?
Introduction
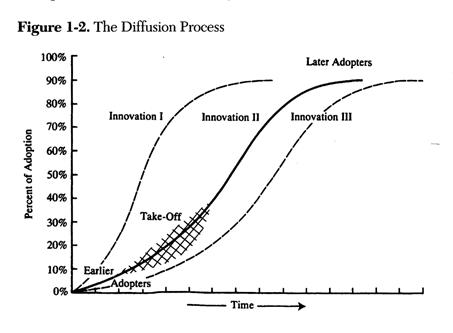
In his classic work, (Rogers, 2003), Everett Rogers proposed the non-linearity of innovation adoption and its nature. Multiple examples are quoted including the emergence of the “Internet” up to 2003.
Figure 1. Diffusion of Innovations, Everett Rogers – for our purpose the “Rogers’ curve”
The economist Paul Krugman[1] famously stated that “productivity isn’t everything, but, in the long run, it is almost everything”.
[2]“The reason productivity is so important, Krugman continued, is that “a country’s ability to improve its standard of living over time depends almost entirely on its ability to raise its output per worker”.
From these two notions, it can be conjectured:
An innovation may increase “utility”, that is to say “improve quality of life” to those exposed[3]. A narrow proxy for utility is “productivity” which is an understood measurement in the U.S. and Australia. There are other perspectives on innovation effects e.g. “consumer welfare”[4] but these are out of scope.
Change in utility from an innovation can follow a “future offset” Rogers’ curve.
Within a Rogers’ curve, “fractal” Rogers’ curves may be observed caused by discontinuities in an innovation’s evolution e.g. in a “creative destruction” [5].
In the “late stage” Rogers’ curve, adoption rates can decline and innovations can turn “toxic”, reducing utility. Benefits often accrue early in the cycle and costs are deferred but as use increases, can grow in a non-linear fashion e.g. PFA’s.
“I.T.” including computation and communication began life as an innovation in the late 1940’s.
The innovation of I.T. follows the Rogers’ “curve” and two significant Rogers’ curves can be observed within – from the personal computer “PC” starting in the late 1970’s and the “Internet” revolution born in the late 1980’s.
A third potential significant discontinuity, “AI” as commonly understood, (not as a tool in functional niches), is now observed. The nature of this discontinuity and its effects on utility are as yet unknown.
In this analysis, the “PC”, “Internet” and “AI” discontinuities are compared and considered within the I.T. Rogers’ curve.
The “PC”
The dramatically reduced cost of computing power though the 60’s and 70’s (as illustrated by Gordon Moore’s misnamed but pertinent “Moore’s Law”[6]) lead to the emergence of “garage band” entrepreneurs e.g. Microsoft, Apple that sought to deliver to a much broader community the facilities for computation, hitherto the preserve of the “Big” – government, corporations, military. Concurrent developments in software functionality enabled by cheaper computing power e.g. the “GUI” would accelerate the innovation cycle.
What were the effects?
1. Industry disruption; the I.T. industry, dominated by mainframe e.g. Amdahl, Sperry-Univac etc. and mini-computer players e.g. Data General, Digital Equipment was transformed by a convulsion so violent that eventually even IBM was brought low. Hardware and operating systems were commodified and de facto standardised; “Open Source” e.g. Linux emerged. This was an “asset light” and democratising revolution.
2. A mania? The 1980’s saw, to quote the Federal Reserve[7]:
“The first contemporary global financial crisis unfolded on October 19, 1987, a day known as “Black Monday,” when the Dow Jones Industrial Average dropped 22.6 percent.”
However, this was not an event associated particularly with investment in the I.T. sector; other more significant forces were at play including the enablement of automated trading by cheaper computing power where individual interests combined to generate a vortex of market decline[8].
3. Utility; The “PC” enabled businesses to dramatically reduce the costs of their non-value adding work. New direct sales and marketing processes enabled by low-cost data management software enabled higher productivity in the delivery of targeted goods and services without the need for expensive “mass media”. The personalisation of marketing and media had begun.
However, in 1987, Robert Solow[9] remarked “You can see the computer age everywhere but in the productivity statistics”, leading to the term “Solow Paradox” where high levels of investment in digital technology do not lead to immediate economic benefit. In fact, during the 80’s economic growth in the U.S. declined.
Explanations might include:
Industry disruption is expensive and often resisted; a period of economic readjustment was necessary when generalised benefits were hard to discern as productive assets were dismantled and created a new in other configurations.
Lags from inertia and “frictions” applied to expenditure; capital equipment demands adaptation to be productive. It is conceivable that material productivity improvements were only realised when intra-entity “PC networking”, in support of commodified business management applications, was enabled.
The rise of the service sector as a proportion of the economy, in some ways a result of the reduced cost of computing power, in which it is difficult to measure “productivity”.
Difficulties in accounting for the new technology: hardware, software and services which is still a matter of debate and amendment by authorities[10].
The “Internet”
“Big” military, industry and academic networks had been in situ since the 60’s (Rogers, 2003) and a functional example of the “Internet” extant in France (“Minitel”[11]) since 1980, so the “Internet” concept was familiar. The reducing cost of I.T. equipment and “open standards” enabled the deployment of a commoditised tool for electronic communication. It can be argued that the emergence of the “Internet” within CERN itself followed a Rogers’ curve (Berners-Lee, 1999). Great hopes were vested in this technology for human advancement, not least by Berners-Lee himself[12]. In February 1996, the Section 630[13] ruling, confirmed the belief that new voices should emerge to challenge the existing political and media status quo. The Wall had fallen.
As per DeLong (DeLong, 2000), the “Solow Paradox” appeared to be resolved in the early to mid-nineties. DeLong made the following remark:
” The almost inevitable conclusion is – as Oliner and Sichel (2000) have argued most powerfully – that the computer sector has in the past decade come of age as a macroeconomic factor. The productivity speed-up is due primarily to events in information technology.”
DeLong predicted a continued realisation of net benefit from I.T. investment both within and outside the U.S. economy in the following decade.
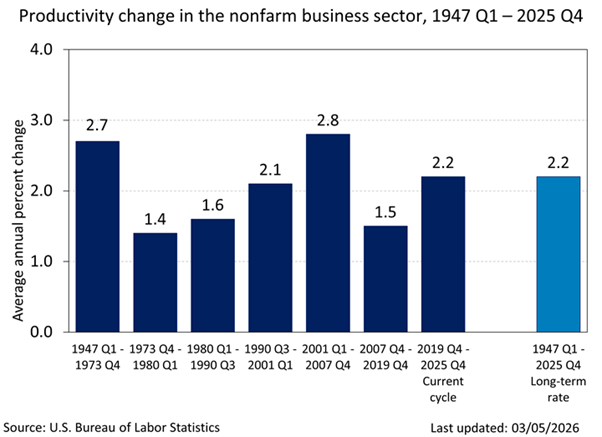
Productivity in the U.S. and Australia
DeLong was apparently justified by the U.S. in the 2000’s. The factors that cause “productivity” change cannot be easily identified or quantified {“correlation is not causation” etc.) but it appears that cheap, integrated computing power had a very positive influence up to 2007.
Remarkably, this improvement in utility occurred after the bursting of the e-commerce bubble in 2000 when as The Economist[14] remarks: “The Super Bowl of 2000 passed into market folklore as having epitomised internet-stock mania; no fewer than 17 dotcom firms paid millions of dollars each for 30 second advertising slots. Weeks later share prices fell into a brutal bear market”.
It appears that in the U.S. a Rogers’ curve for I.T. was observed from the late 1940’s. Early adoption by the “Big” – government, the military, was followed by a period of quietude (Only seven of the Ferranti Mark 1 machines were sold in the 1950’s[15]) as underlying tectonics realigned. The “PC” and “Internet” revolutions, themselves observed as “fractal” Rogers’ curves, ignited a “Take-Off” in the late 1980’s that continued until circa 2007. As conjectured. utility from I.T. as expressed by productivity seems to have followed an aligned and offset Rogers’ curve from adoption.
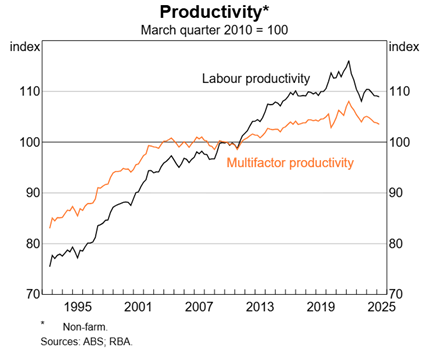
A similar pattern in Australia to the U.S. is observed where it appears that a combination of factors, arguably including the dividend of cheap computing power utilisation resulted in significant improvements in utility during the decades around the turn of the century.
The RBA (R.B.A., 2025) comments:
“For example, labour productivity (output per hour worked) currently sits around its 2016 level, whereas it grew very strongly from the mid-1990s to mid-2000s.”
The Data-Processing Engine
All good things come to an end as would be expected by reference to the Rogers’ curve, its extrapolation to utility and the nature of the data-processing engine.
Limits are reached – there is only a certain speed at which received information can be wisely processed and I.T. assets “rot” almost immediately from their deployment as changes are made to functionality and configuration; increasing monies are spent on the maintenance of existing systems, not the implementation of innovation. Network effects only go so far, “legacy” and barriers to entry emerge.
Business practices and processes that were once performed at very low levels of “friction” are increasingly burdened with bureaucratic interventions (often of dubious merit and ironically only possible because of I.T.) and bad actors.
Take cybersecurity, which although estimated[16] at only a fractional percentage of Australian GDP (0.04%) expenditure is nevertheless a significant impost on this economy. This technology often reduces the operational efficiency of processes either directly or indirectly and is a cost, either in I.T. system maintenance or an insurance against contingent risk.
“AI”
“Social media” has been extremely disruptive in its effects since the late 2000’s though it does not appear at first glance to have improved utility either in the U.S. or Australia[17]. Will “AI” change the effect of I.T. investment?
Consider “AI” versus the “PC” and the “Internet”:
A tenor of “fear and loathing”[18] is abroad, not hope and optimism as previously observed. This is evidenced by:
“AI” as a justification for white-collar work redundancies e.g. the C.B.A, Block and Atlassian[19][20].
Evidence of exploitative work practices supporting the provision of “AI” (Muldoon, 2024).
The emblematic lawsuit between Open-AI and its partner Microsoft[21] and the New York Times regarding the alleged theft of intellectual property from that publisher.
Top-down, scare-tactic, propaganda by “AI” players governments – “LinkedIn” et al.
Social unrest around the technology and its perceived consequences.[22]
“Asset-heavy”, not “Asset-Light”; “AI” data-processing is extremely complex and energy-intensive therefore expensive and condensed, the opposite of the “PC” and “Internet” proposition, even if the driver, cheaper unit processing power, is the same. To quote The Economist[23] again “Alphabet, Amazon, Meta and Microsoft have said they will spend US660bn on “AI” in 2026, staggering sums.” According to the IEA, electricity supply for “AI” is planned to grow in six years from 460 TWH to 1000 TWH, circa 3% of total present global generating capacity[24]. Further study is advised to determine the viability of this proposition.
Markets remain sceptical of “Big Tech” expenditure on “AI” and uncertain of valuations[25]. They have not afforded entrants the euphoria of the dot-com era[26][27]. Other factors, including circular financing[28] by some “AI” players may have brought some caution to the table. Markets have punished both the work-platform firms e.g. Atlassian, ServiceNow and their antagonistic “AI” entities on the same day.[29] The primary characteristic of “bubbles” (Shiller, 2008), “social contagion” is not yet on vivid display. The forthcoming IPOs of Open-AI, Anthropic and Space-X may tell a different story.
The Thrill has Gone
The I.T. Rogers’ curve. is now eighty-years old, an aging boomer whose glory days are long gone as measured by the conjectured proxy for utility. Will “AI” re-energise the delivery of utility from I.T. on its own Rogers’ curve?
The following, based on a comparison with the “PC” and the “Internet” suggest not:
The “vibe” of the “PC” and “Internet” revolutions is markedly absent.
intense concentration of the assets required for “AI” deployment within an existing circle of agency, the empire[30] of “Big Tech” and its totalitarian peers.
The stated aim which appears to be the reduction of utility, “Productivity” is to be improved by the reduction of cost through increased unemployment and diminished freedom. The mechanism? The theft of human expertise using the pernicious drug of convenience.
Markets are ambivalent.
With luck, uncertain and trimmed by the Iran conflict, they will decide it is not worth it.
Bibliography
Berners-Lee, T. (1999). Weaving the Web. Orion Business Books.
DeLong, J. B. (2000). https://www.rba.gov.au/publications/confs/2000/delong.html. Resreve Bank of Australia.
Muldoon, Graham and Cant. (2024). Feeding the Machine: The Hidden Human Labour Powering AI. Bloomsbury.
[3] “Exposed” describes a multitude of personal and organisational experiences. Benefits and costs will not accrue equally across the “exposed” but a generalised improvement in utility could be said to apply when for “most of the people, most of the time”.
[4] https://conversableeconomist.com/2021/02/24/robert-j-gordon-thoughts-on-long-run-us-productivity-growth/ and The Rise and Fall of American Growth, Robert J. Gordon, 2016 ISBN 9780691175805
Looking for clues in Python Programming Productivity – “AI” Sludge vs. Clear Exposition.
Python Documentation
There’s abstruse and incomprehensible and surely most formal Python documentation for the average business technician/knowledge-worker/hacker/scribbler/programmer meanders somewhere in between. Communities emerged to cope StackOverflow, Youtube etc. No “RTFM” for these guys and gals, more “DIY”. Ten years ago, quite a shock for a geezer thrown in to the pool of methods and objects. Where’s the register? And pythonistas were you taught not to comment your code.
Keep it Simple Stupid (“KISS”)
A golden rule of computer science etc. used to be “KISS”. Was this ever a rule, more an observation? Like Moore’s Law a bit of a misnomer.
Assume “KISS” is still a rule (like “GIGO”).
If “KISS” is a rule does “AI” simplify?
Like for example, a Youtube video by somebody who, with clear and concise explanation, very easily makes things simple. Somebody who knows how to educate. Corey Schafer that’s you.
Or a well-written note that matches the “what” with the “how”, featuring more than the occasional snippet.
Productivity doing hard things will not be improved by throwing more at the wall, the default response of an “AI” prompt.
Perhaps we should be grateful. Any idiot can make the complex complicated. Making the complex simple requires a mind.